BP is a global energy company with operations in 65 countries. The upstream production is c. 2.2mn boe/day. The company operates refining and hydrocarbon capacity, 13,100 EV charge points, and 20,500 retail sites. BP announced its target to transform the business by adding 20GW of renewable generating capacity by 2025 and 50GW by 2030. The number of EV points will be increased to 100,000 globally by 2030.
BP is a global energy company based in the UK. The company's segments include gas & low carbon energy, oil production & operations, and customers & products. The gas & low carbon energy segment comprises its gas and low carbon businesses. Its gas business includes regions with upstream activities that produce natural gas, integrated gas and power, and gas and power trading. Its low carbon business includes solar, offshore, and onshore wind, hydrogen, and carbon capture and storage (CCS) and its share in bp Bunge Bioenergia. The oil production & operations segment comprises regions with upstream activities that produce crude oil. The customers & products segment comprises customer-focused business spanning convenience and mobility, which includes convenience and retail fuels, electric vehicle (EV) charging, as well as Castrol, aviation, and midstream.
The global energy market remains under the influence of several factors: the Ukraine-Russia conflict resulted in the decrease of the energy products supply from Russia to Europe; Chinese macro remains challenging; high inflation; and a strong US dollar. World oil demand is estimated at 103mb/d in 2023. Energy markets stabilitied in terms of supply and price in 2023.
- BP is the global energy player, with global operations in over 65 countries
- BP operates in three segments: gas & low carbon energy including gas production and marketing, renewables, and hydrogen expansion; oil production & operations, refining, and bioenergy; customers & products. In customers&products the company aims to double adj EBITDA by 2030 via acceleration of EV charging, via Castrol, aviation, B2B, and midstream businesses selective growth
- BP's business provides sustainable cash flow to maintain investments in fossil maintenance and renewables development. The payback is less than 10 years for upstream oil and refining, and less than 15 years for upstream gas
- BP focuses on shareholder return maintaining a buyback program and stable dividend payout
- BP has a large retail business benefiting from both product diversification and integration of operations from exploration and production to retail distribution
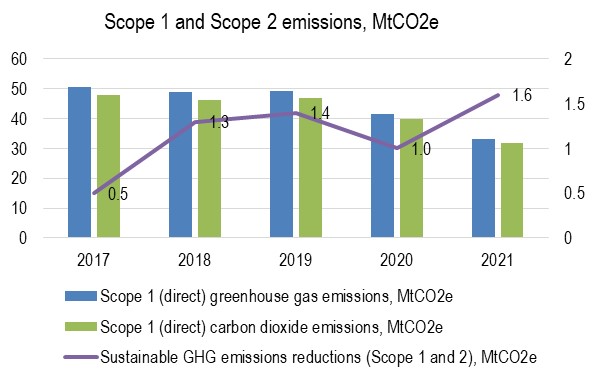
- BP may have exposure to potentially declining oil demand and a weakening oil price environment due to climate change politics and projects the fossil output decline to 1.5mboe/d from 2.2mn boe/d by 2030
- BP may meet high capex needs due to the transformation of the business in favor of renewables
- Divestment of Rosneft will negatively affect BP cash flows
- High volatility of oil price on the back of geopolitical changes
- Supply chain disruptions in the EV segment and solar panels
- Weakerining macro globally with lower demand for hydrocarbons, higher inflation, and slow growth projected
- Geopolitical risks affect the oil market. The sale of BP's stake in Rosneft depends on the Ukraine-Russia war developments
- Cost inflation accelerated which may result in long payback periods for new investments
- The transition to a low-carbon economy will imply developments in policy, law, regulation, technology, and markets. As a result, the company may see a reduction in revenue, profitability, and payback periods for its investments
- The company has to invest in reserves and resources to maintain its production of hydrocarbons, which will depend on the company's ability to find economically reliable resource base
| Company | RIC | Market Capitalization, $mn | Last reporting year | P/E Fwd 1Y | P/E Fwd 2Y | EV/EBITDA 1Y fwd | EV/EBITDA 2Y fwd | EV/Revenues 1y fwd | EV/Revenues 2y fwd |
|---|---|---|---|---|---|---|---|---|---|
| BP PLC | BP.L | 105,831 | 2023-12-31 | 7.6 | 6.9 | 3.7 | 3.7 | 0.8 | 0.8 |
| TotalEnergies SE | TTEF.PA | 164,007 | 2023-12-31 | 7.7 | 7.7 | 4.1 | 4.2 | 0.8 | 0.8 |
| Eni SpA | ENI.MI | 53,535 | 2023-12-31 | 6.8 | 6.7 | 3.6 | 3.5 | 0.8 | 0.8 |
| Equinor ASA | EQNR.OL | 79,863 | 2023-12-31 | 8.1 | 7.8 | 1.9 | 1.9 | 0.8 | 0.8 |
| Shell PLC | SHEL.L | 213,564 | 2023-12-31 | 8.2 | 8.1 | 4.0 | 4.2 | 0.8 | 0.8 |
| Repsol SA | REP.MC | 20,349 | 2023-12-31 | 5.0 | 5.2 | 2.5 | 2.6 | 0.4 | 0.4 |
| 2017 | 2018 | 2019 | 2020 | 2021 | 2022 | 2023 | 2024 | 2025 | |
|---|---|---|---|---|---|---|---|---|---|
| Revenue | 240,208 | 298,756 | 159,307 | 105,944 | 157,739 | 241,392 | 210,130 | 210,608 | 207,060 |
| Growth | 24% | -47% | -33% | 49% | 53% | -13% | 0% | -2% | |
| EBITDA | 25,375 | 33,046 | 33,737 | 8,666 | 26,588 | 55,473 | 47,962 | 42,500 | 42,741 |
| EBITDA margin | 10.6% | 11.1% | 21.2% | 8.2% | 16.9% | 23.0% | 22.8% | 20.2% | 20.6% |
| Net income | 3,389 | 9,383 | 4,026 | -20,305 | 7,565 | -2,487 | 15,239 | 14,044 | 14,394 |
| Net margin | 1.4% | 3.1% | 2.5% | -19.2% | 4.8% | -1.0% | 7.3% | 6.7% | 7.0% |
| Net debt | 39,007 | 44,459 | 56,481 | 52,399 | 43,566 | 31,586 | 31,586 | 31,586 | 31,586 |
| MktCap | 125,680 | 70,510 | 90,599 | 90,599 | 78,714 | 73,742 | 73,747 |
Historical Multiples
| 2019 | 2020 | 2021 | 2022 | 2023 | 2024 | 2025 | |
|---|---|---|---|---|---|---|---|
| EV/Revenue | 1.1 | 1.2 | 0.9 | 0.5 | 0.5 | 0.5 | 0.5 |
| EV/EBITDA | 5.4 | 14.2 | 5.0 | 2.2 | 2.3 | 2.5 | 2.5 |
| P/E | 31.2 | -3.5 | 12.0 | -36.4 | 5.2 | 5.3 | 5.1 |